Next: B..2.2 単振動の方程式 Up: B..2.1 Malthus モデル Previous: B..2.1.1 odeint() の利用
区間をどのように分割するかは、ユーザーが指定するのではなく、 自動的に決められる。 そのかわり、以下のサンプル・プログラムでは、 rtol=, atol= で許容される誤差を指定する。 内部で、いわゆる刻み幅の自動調節が行われる。
詳しいことは scipy.integrate.solve_ivp -- ScyPy v1.11.3 Manual を見よ。
| malthus3.py |
# malthus3.py --- dx/dt=a*x, x(0)=x0 を複数の初期値について解いて解曲線を描く
import numpy as np
from scipy.integrate import solve_ivp
import matplotlib.pyplot as plt
def malthus(t, x, a): # 順番に注意 f(t,x,パラメーター)
return a * x
a=1
t0=0; T=1; n=10
t=np.linspace(t0,T,n+1)
for i in range(0,10):
x0=[i*0.2] # スカラーでない
sol=solve_ivp(malthus, [t0,T], x0, args=(a,),
dense_output=True, rtol=1e-6,atol=1e-8)
x=sol.sol(t)
# 解曲線描画
plt.plot(t,x.T, label='x0='+'{:6.1f}'.format(x0[0]))
plt.ylim(0, 5) # 縦軸の範囲指定
# タイトル、凡例の位置、横軸と縦軸の説明、グリッド
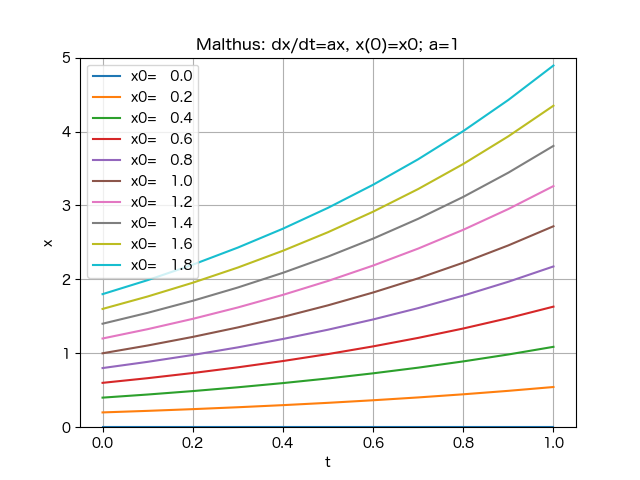
plt.title('Malthus: dx/dt=ax, x(0)=x0; a='+str(a))
plt.legend(loc='upper left')
plt.xlabel('t')
plt.ylabel('x')
plt.grid()
plt.show()
|