Next: 3.3.2 Runge-Kutta法のCプログラム Up: 3.3 C言語によるプログラム例 Previous: 3.3 C言語によるプログラム例
| euler2ex1.c |
/*
 * euler2ex1.c (Euler method for van der Pol equation)
 */

#include <stdio.h>

double mu = 1.0;

int main(void)
{
  int i, N;
  double t, x, y, dt, dx, dy;
  double fx(double, double, double), fy(double, double, double), x0, y0;
  double Tmax;
  // 初期値
  x0 = 0.1; y0 = 0.1;
  // 最終時刻
  Tmax = 50.0;
  // 時間刻み
  printf("# N: "); scanf("%d", &N);
  dt = Tmax / N;
  // 初期値
  t = 0.0;
  x = x0;
  y = y0;
  printf("# t x y\n");
  printf("%f %f %f\n", t, x, y);
  // Euler 法
  for (i = 0; i < N; i++) {
    dx = dt * fx(x, y, t);
    dy = dt * fy(x, y, t);
    x += dx;
    y += dy;
    t = (i + 1) * dt;
    printf("%f %f %f\n", t, x, y);
  }
  return 0;
}

double fx(double x, double y, double t)
{
  return y;
}

double fy(double x, double y, double t)
{
  return - x + mu * (1.0- x * x) * y;
}
|
| 解曲線を描く |
|
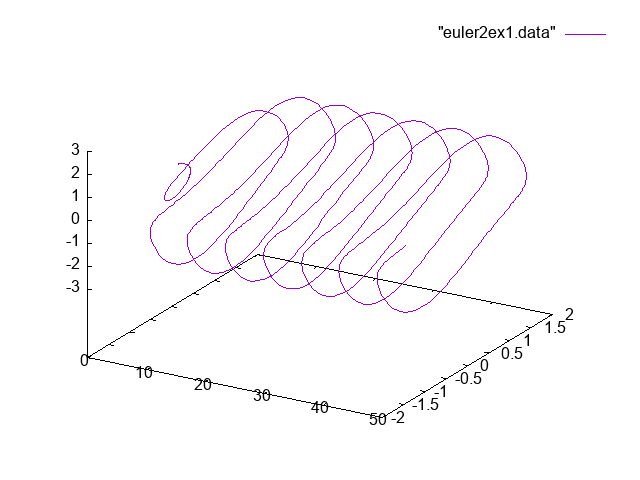
% cglsc euler2ex1.c
% ./euler2ex1 > euler2ex1.data 1000 % gnuplot (ここで gnuplot の起動メッセージが表示されるが省略) gnuplot> splot "euler2ex1.data" with l (以下はグラフの保存) gnuplot> set term png gnuplot> set output "euler2ex1_txy.png" gnuplot> replot gnuplot> quit % |
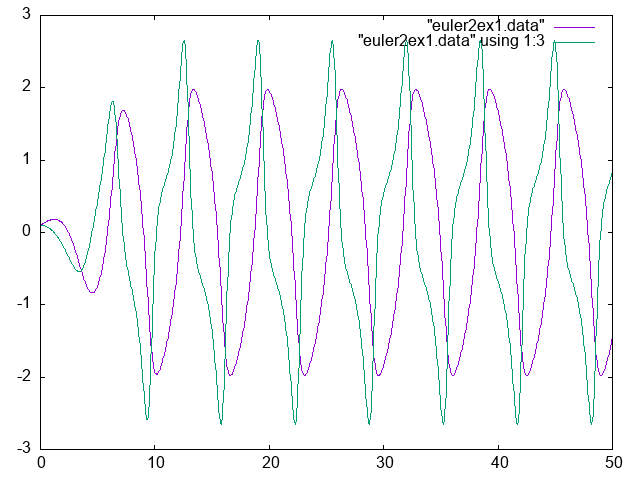
同じデータファイル euler2ex1.data を使って、 色々なグラフが描ける。 gnuplot の using a:b (a列目とb列目のデータを使う) という指示を利用する。
|
% gnuplot
(ここで gnuplot の起動メッセージが表示されるが省略) gnuplot> plot "euler2ex1.data" with l, "euler2ex1.data" using 1:3 with l (以下はグラフの保存) gnuplot> set term png gnuplot> set output "euler2ex1_tx_ty.png" gnuplot> replot gnuplot> quit % |
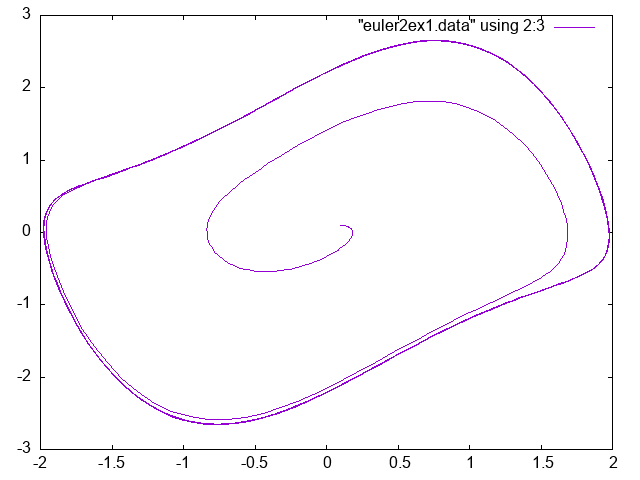
| 解軌道を描く |
|
% gnuplot
(ここで gnuplot の起動メッセージが表示されるが省略) gnuplot> plot "euler2ex1.data" using 2:3 with l (以下はグラフの保存) gnuplot> set term png gnuplot> set output "euler2ex1_xy.png" gnuplot> replot gnuplot> quit % |
問6
上の実行例では、![]() (区間をいくつの小区間に分割するか) を
(区間をいくつの小区間に分割するか) を ![]() にしたが、
にしたが、
![]() が
が ![]() のときどうなるか試してみよ
(数値的安定性の話)。
のときどうなるか試してみよ
(数値的安定性の話)。
桂田 祐史