Next: 8.4 Manipulate[] Up: 8.3 もう少し詳しく Previous: 8.3.6 ContourPlot[], DensityPlot[]
![]() 変数関数のグラフを描く Plot3D[] は
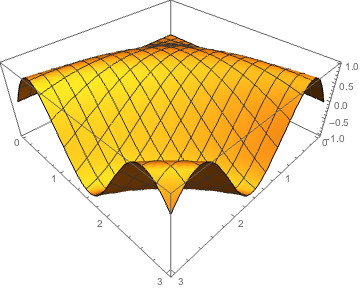
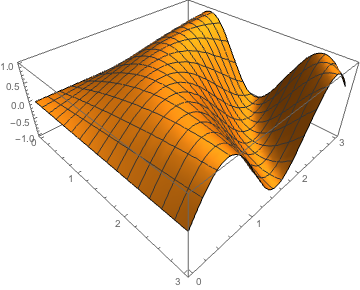
変数関数のグラフを描く Plot3D[] は
Plot3D[f, {x,xmin,xmax}, {y,ymin,ymax}]
が基本的な使い方。例えば
Plot3D[Sin[x y], {x,0,3}, {y,0,3}]
|
    HiddenSurface -> False          隠面消去をしない
    PlotPoints -> 個数              大きくすると細かい図を書く。
    ViewPoint -> {x,y,z}            視点の指定
| 視点を色々変えてみる |
my[a_,b_,c_]:= Plot3D[Sin[x y],{x,0,3},{y,0,3}, ViewPoint->{a,b,c}]]
my[1,1,1]
my[1,-1,1]
Table[my[1,t,1],{t,1,-1,-0.2}]
|