Next: 8.1.2 2変数関数のグラフ Plot3D[] Up: 8.1 まずはやってみよう Previous: 8.1 まずはやってみよう
1変数関数のグラフを描くのに Plot[ ] という関数が使える。
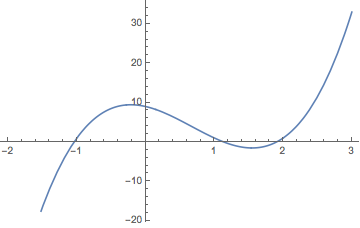
  Plot[4x^3-8x^2-4x+9,{x,-2,3}]

  Plot[4x^3-8x^2-4x+9,{x,-2,3},PlotRange->Full]

  Plot[4x^3-8x^2-4x+9,{x,-2,3},PlotRange->Full,AspectRatio->1]

  Plot[4x^3-8x^2-4x+9,{x,-2,3},PlotRange->Full,AspectRatio->Automatic]
|
Option の選び方は案外難しい。 余裕のあるときに、 Plot[] のヘルプを参考に色々試してみることを勧める。
グラフィックス関係のオプションについては、 8.3.2 を参照すること。