Next: B..3.3 単振動の方程式 Up: B..3 Julia によるシミュレーション Previous: B..3.1 Juliaのインストール&使い方
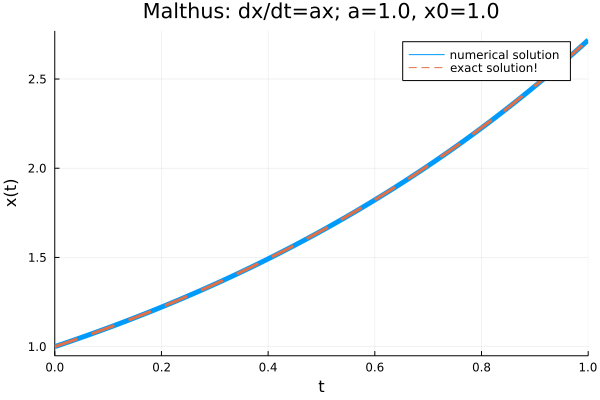
| malthus1.jl |
# malthus1.jl --- dx/dt=a*x, x(0)=x0 を解いて解曲線を描く

using DifferentialEquations
using Plots

f(u,a,t) = a*u  # x,パラメーター,t

a=1.0
t0=0.0; T=1.0; tspan = (t0, T)
x0=1.0
prob = ODEProblem(f,x0,tspan,a)
sol = solve(prob, Tsit5(), reltol=1e-8, abstol=1e-8);

plot(sol,linewidth=5,title="Malthus: dx/dt=ax; a=1.0, x0=1.0",
     xaxis="t", yaxis="x(t)", label="numerical solution") # legend=false
plot!(sol.t, t->x0*exp(a*t),lw=3,ls=:dash,label="exact solution!")

savefig("malthus1_julia.png")
savefig("malthus1_julia.pdf")
|
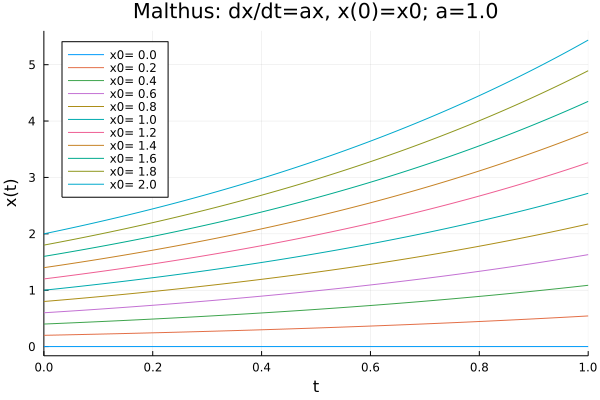
| malthus2.jl |
# malthus2.jl --- dx/dt=a*x, x(0)=x0 を複数の初期値について解いて解曲線を描く

using Printf
using DifferentialEquations
using Plots

f(u,a,t) = a*u  # x,パラメーター,t

a=1.0
t0=0.0; T=1.0; tspan = (t0, T)

for i=0:10
  x0=i*0.2
  prob = ODEProblem(f,x0,tspan,a)
  sol = solve(prob, Tsit5(), reltol=1e-8, abstol=1e-8);
  if i==0
     p=plot(sol, title="Malthus: dx/dt=ax, x(0)=x0; a=1.0",
            xaxis="t", yaxis="x(t)",
	    label=@sprintf("x0=%4.1f", x0), legend=:topleft)
  else
     p=plot!(sol, label=@sprintf("x0=%4.1f", x0))
  end
end

# savefig() しないときは次が必要かも
display(current())

# 図の保存
savefig("malthus2_julia.png")
savefig("malthus2_julia.pdf")
|