next up previous contents
Next: 5 標準出力への出力を保存する方法 Up: 実験に役立つテクニック集    V1.2 Previous: 3 time で時間を計ろう

4 gnuplot でグラフを描こう

-- 簡単な関数のグラフや、計算データの表示には gnuplot が便利 --

gnuplot については、

  1. gnuplot のマニュアル (6701 号室に常備してある。コンピューターの上にも
    /usr/local/meiji/text/graph/gnuplot/gnuplot.dvi
    というパス名で置いてある。)
  2. 矢吹道郎監修、大竹つよし著、使いこなす GNUPLOT, テクノプレス
    (ちょっと食い足りないし、日本語が変だけど、読み易い。)
  3. 桂田作の説明書
    http://nalab.mind.meiji.ac.jp/staffs/mk/sotsuken/gnuplot/
などを見ること。


例として
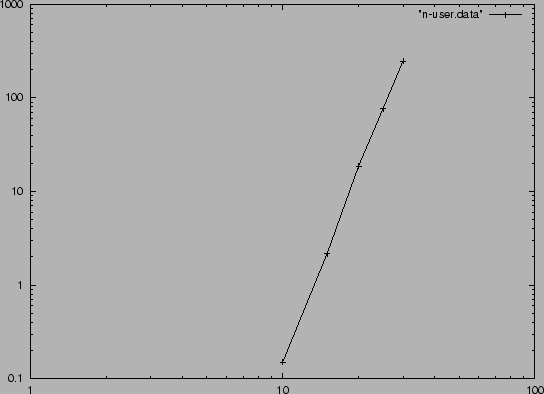
分割数と計算時間の表 ``n-user.data''
10 0.15 
15 2.16 
20 18.68 
25 76.58 
30 247.14

をプロットして分析することを考える3

\includegraphics{n-user0.ps}

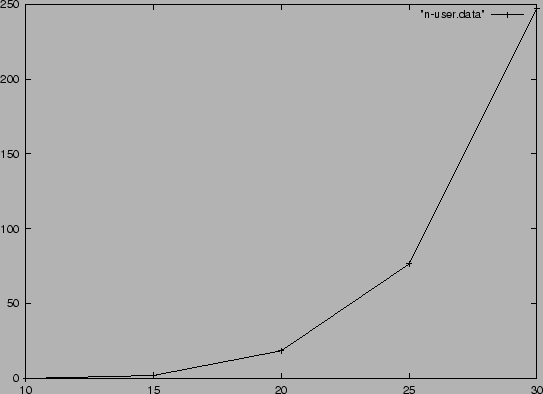
mathpc00% gnuplot                ← gnuplot を起動

	G N U P L O T
	unix version 3.5 (pre 3.6)
	patchlevel beta 325
	last modified Sun Jan  5 21:52:18 GMT 1997

	Copyright(C) 1986 - 1993, 1996
	Thomas Williams, Colin Kelley and many others

	Send comments and requests for help to info-gnuplot@dartmouth.edu
	Send bugs, suggestions and mods to bug-gnuplot@dartmouth.edu

Terminal type set to 'x11'
gnuplot> plot "n-user.data" with linespoints   ← n-user.data をプロット
gnuplot> set logscale xy                       ← x軸, y軸を対数目盛りに
gnuplot> replot                                ← 描き直し
gnuplot> set terminal postscript eps           ← カプセル化 PostScript 形式
gnuplot> set output "n-user.ps"                ← 出力ファイル名の指定
gnuplot> replot                                ← ファイルへ書き出す
gnuplot> set terminal x11                      ← X11形式 (画面へ出力)
gnuplot> set nologscale xy                     ← 対数目盛りをやめる
gnuplot> quit                                  ← 終了
mathpc00%

\includegraphics{n-user.ps}


next up previous contents
Next: 5 標準出力への出力を保存する方法 Up: 実験に役立つテクニック集    V1.2 Previous: 3 time で時間を計ろう
桂田 祐史
2014-05-27