Next: 2.4 解の係数を求める Up: 2 Mathematica による再現 Previous: 2.2 を解く
関数 lambda[] が出来れば、 固有関数のグラフをとりあえず描くのは簡単である。
Table[Plot[Sin[lambda[n] x],{x,0,1}],{n,5}]

Plot[Table[Sin[lambda[n] x],{n,5}],{x,0,1}]
|
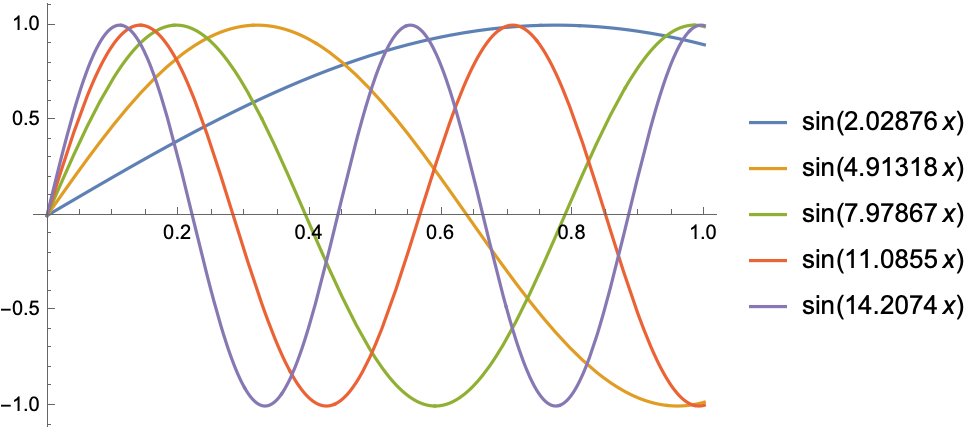
やや分かりにくいので、少し工夫する (グラフの体裁を整えるのは意外と大変)。
gr=Plot[Evaluate[Table[Sin[lambda[n] x],{n,5}]],{x,0,1},PlotLegends -> "Expressions"]
Export["eigenfunction12345.png", gr]
|
Cf. 図1 を、 [1] p. 56 の図7.4 と見比べてみよう。