Next: 8.5 RegionPlot3D[] Up: 8 Mathematica のグラフィックス機能 Previous: 8.3.7 Plot3D[]
(工事中)
熱方程式の基本解
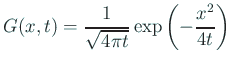
について、
G[x_, t_] := Exp[-x^2/(4 t)]/(2*Sqrt[Pi*t])
g=Plot[Table[G[x, t], {t, 0.1, 1.0, 0.1}], {x, -5, 5}, PlotRange -> All]
Manipulate[Plot[G[x, t], {x, -5, 5}, PlotRange -> {0, 3}], {t, 0.01, 2}]
|
離心率が ![]() の円錐曲線は適当な座標系で
の円錐曲線は適当な座標系で
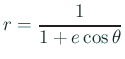
と表すことが出来る。
Manipulate[g=PolarPlot[1/(1 + eps Cos[t]), {t, 0, 2 Pi}], {eps, 0, 2, 0.01}]
|
桂田 祐史
![\includegraphics[width=10cm]{heatkernel.eps}](img267.gif)
![\includegraphics[width=15cm]{eps/conic-curve.eps}](img269.gif)