Next: 11.4 plot Up: 11 TikZ Previous: 11.2 マニュアル
\draw (1,2) -- (3,4); |
\coordinate (文字列) at (x座標,y座標);例えば、
\coordinate (A) at (1,2); \coordinate (B) at (3,4); \draw (A) -- (B); |
\draw 中心 circle [radius=半径];
\fill 点 circle [radius=半径];のようにして塗ることにしている。
\begin{tikzpicture}
 \coordinate (O) at (0,0);
 \coordinate (A) at (2,0);
 \coordinate (B) at (1,1);
 \draw (O) -- (A) -- (B) -- cycle;
 \fill (O) circle [radius=2pt];
 \fill (A) circle [radius=2pt];
 \fill (B) circle [radius=2pt];
\end{tikzpicture}
|
似ているけれど [scale=倍率] を使うと、 2ポイントと指定した円の長さも大きくなる。
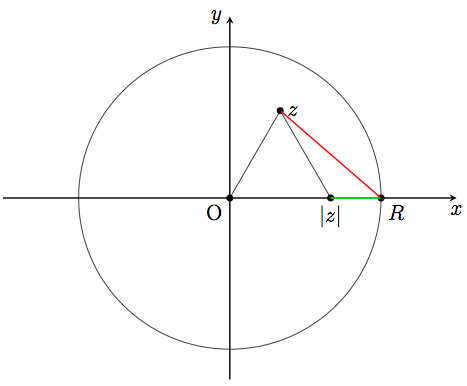
\begin{tikzpicture}[x=3cm,y=3cm]
 \coordinate [label=below left:$\mathrm{O}$](O) at (0,0);
 \coordinate (A) at (0.66666,0) node at (A) [below=0] {$|z|$};
 \coordinate (B) at (1,0) node at (B) [below right=0] {$R$};
 \coordinate (P) at (0.333333,0.57735) node at (P) [above=0.1,right=0] {$z$};

 \draw [thick, -stealth](-1.5,0)--(1.5,0) node [anchor=north]{$x$};
 \draw [thick, -stealth](0,-1.2)--(0,1.2) node [anchor=east]{$y$};

 \fill (O) circle [radius=2pt];
 \fill (A) circle [radius=2pt];
 \fill (B) circle [radius=2pt];
 \fill (P) circle [radius=2pt];

 \draw (O) -- (P);
 \draw [red,thick] (P) -- (B);
 \draw [green,thick] (A) -- (B);
 \draw (P) -- (A);
 \draw (O) circle [radius=1];
\end{tikzpicture}
|
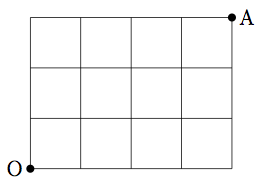
\begin{tikzpicture}
 \coordinate [label=left: {$\mathrm{O}$}] (O) at (0,0);
 \coordinate [label=right:{$\mathrm{A}$}] (A) at (4,3);
 \foreach \x in {0,1,2,3,4} \draw (\x,0)--(\x,3);
 \foreach \y in {0,1,2,3} \draw (0,\y)--(4,\y);
 \fill (O) circle [radius=0.08];
 \fill (A) circle [radius=0.08];
\end{tikzpicture}
|
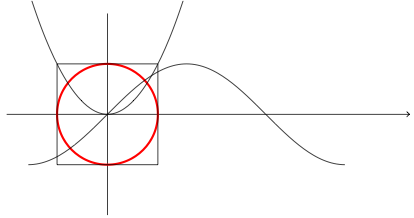
\begin{tikzpicture}
  \draw [->,thick] (-2,0) -- (2,0);% → 付きの線分を太く
  \draw (0,-2) -- (0,2);
  \draw [very thick,red] (0,0) circle [ radius=1 ];% 中心=(0,0), 半径=1
  \draw (-1,-1) rectangle (1.0,1.0); % 左下=(-1,-1), 右上=(1,1)
  \draw (0,0) parabola (1.5,2.25);
  \draw (0,0) parabola (-1.5,2.25);
  \draw (-1.57,-1) cos (0,0) sin (1.57,1) cos (3.14, 0) sin (4.71,-1);
\end{tikzpicture}
|