Next: 10.4 plot Up: 10 TikZ Previous: 10.2 マニュアル
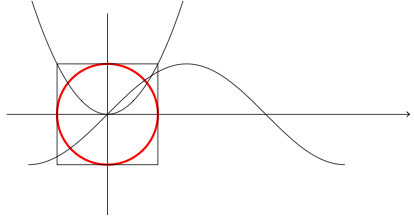
\begin{tikzpicture}
  \draw [->,thick] (-2,0) -- (2,0);% → 付きの線分を太く
  \draw (0,-2) -- (0,2);
  \draw [very thick,red] (0,0) circle [ radius=1 ];% 中心=(0,0), 半径=1
  \draw (-1,-1) rectangle (1.0,1.0); % 左下=(-1,-1), 右上=(1,1)
  \draw (0,0) parabola (1.5,2.25);
  \draw (0,0) parabola (-1.5,2.25);
  \draw (-1.57,-1) cos (0,0) sin (1.57,1) cos (3.14, 0) sin (4.71,-1);
\end{tikzpicture}
|
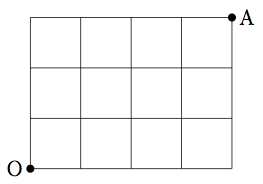
細かい工夫が色々可能である。頻繁に出て来る「重要な」点は、 \coordinate コマンドで、 名前をつけて参照することが出来る (同時にラベルを書くことも可能)。
\foreach で繰り返しを指定することも可能である (格子を描くのに便利だ)。
\begin{tikzpicture}
 \coordinate [label=left: {$\mathrm{O}$}] (O) at (0,0);
 \coordinate [label=right:{$\mathrm{A}$}] (A) at (4,3);
 \foreach \x in {0,1,2,3,4} \draw (\x,0)--(\x,3);
 \foreach \y in {0,1,2,3} \draw (0,\y)--(4,\y);
 \fill (O) circle [radius=0.08];
 \fill (A) circle [radius=0.08];
\end{tikzpicture}
|