Next: 3.10 入出力の書式 (とりあえずの例) Up: 3.9 行列・ベクトル演算 Previous: 3.9 行列・ベクトル演算
WWWサイトから、Stable Release (2024/9/10現在、version 3.4.0) のファイルを取ってきて、 インストールするのは簡単である。
eigen-3.4.0/INSTALL というファイルを読むと、 二つの方法が書かれている。
方法1は単純で、マニュアルでコピーする感じ。 eigen-3.4.0/Eigen というディレクトリィをどこか適当な場所 (インクルード・ファイルを置くことにしてあるディレクトリィ) にコピーする、というものである。 私はその手のディレクトリィは、 通常 /usr/local/include にコピーすることにしているにしているので、 それを踏襲すると次のようになる。
| 方法1: ターミナルで実行 |
curl -O https://gitlab.com/libeigen/eigen/-/archive/3.4.0/eigen-3.4.0.tar.gz tar xzf eigen-3.4.0.tar.gz cd eigen-3.4.0 sudo mkdir -p /usr/local/include sudo cp -pr Eigen /usr/local/include |
こうしてインストールした場合はコンパイル時に、 -I /usr/local/include というオプションを使うことになる。
方法2は cmake を使うものである。
| 方法2: ターミナルで実行 |
curl -O https://gitlab.com/libeigen/eigen/-/archive/3.4.0/eigen-3.4.0.tar.gz tar xzf eigen-3.4.0.tar.gz mkdir eigen-build cd eigen-build cmake ../eigen-3.4.0 sudo make install |
| [ |
l]ball.cpp
https://m-katsurada.sakura.ne.jp/program/ode_prog/ball.cpp
/*
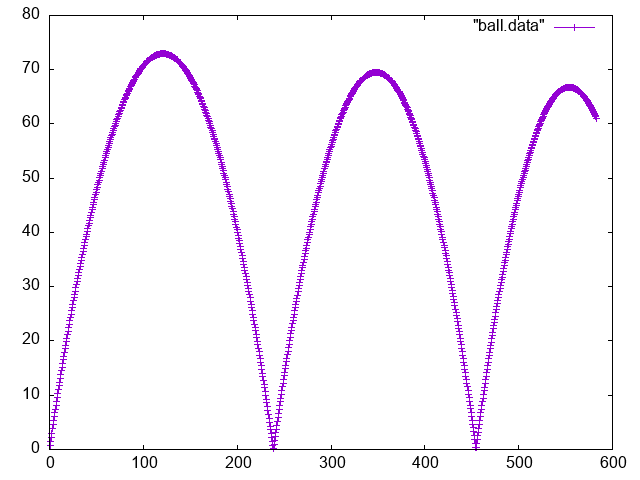
* ball.cpp --- はねるボール
* http://nalab.mind.meiji.ac.jp/~mk/program/ode_prog/ball.cpp
* cc -I /usr/local/include ball.cpp
* ./a.out > ball.data
* gnuplot で plot "ball.data" with lp
*/
#include <iostream>
#include <math.h>
#include <Eigen/Dense>
using namespace Eigen;
double m, g, Gamma, e;
VectorXd f(double t, VectorXd x)
{
VectorXd y(4);
y(0) = x(2);
y(1) = x(3);
y(2) = - Gamma / m * x(2);
y(3) = - g - Gamma / m * x(3);
return y;
}
int main(void)
{
int n, N;
double tau, Tmax, t,pi;
VectorXd x(4),k1(4),k2(4),k3(4),k4(4);
pi = 4 * atan(1.0);
m = 100;
g = 9.8;
Gamma = 1.0;
e = 1.0;
Tmax = 20;
N = 1000;
tau = Tmax / N;
x << 0,0,50*cos(pi*50/180),50*sin(pi*50/180);
for (n = 0; n < N; n++) {
t = n * tau;
k1 = tau * f(t, x);
k2 = tau * f(t+tau/2, x+k1/2);
k3 = tau * f(t+tau/2, x+k2/2);
k4 = tau * f(t+tau, x+k3);
x = x + (k1 + 2 * k2 + 2 * k3 + k4) / 6;
if (x(1)<0) {
x(1) = - x(1);
x(3) = - x(3);
}
std::cout << x(0) << " " << x(1) << std::endl;
}
}
|
| 入手して実行する |
curl -O https://m-katsurada.sakura.ne.jp/program/ode_prog/ball.cpp
c++ -I/usr/local/include -o ball ball.cpp
./ball > ball.data
gnuplot
gnuplot が起動して gnuplot> というプロンプトが表示される。 gnuplot> plot "ball.data" with lpこれでボールの軌跡が描かれる。以下は画像ファイルへの保存。 gnuplot> set term png gnuplot> set output "ball.png" gnuplot> replot gnuplot> quit |